VA Loan Data Study Overview: 2023 Update
Written by:
Frank Luisi
Frank is a VP at Own Up where he is responsible for business development and launching new products. He is a licensed property/casualty and title insurance producer.
See full bio


This is an update to the study we published in 2022 that exposed the disparity in mortgage interest rates offered to VA borrowers by the top 20 VA lenders. We’re updating this data and highlighting what’s changed, and what hasn’t, for VA borrowers.
What’s apparent from our study is that all borrowers are not treated equally, and this remained true in 2023. It is important that veterans shop around because data from HMDA shows that interest rates and closing costs vary widely among lenders.
Here are three reasons why Veterans overpay on their mortgage:
1. Lenders set higher profit margins on VA loans
Mortgage lenders claim that VA loan transactions are more challenging to process and take longer to close than conventional loans. Lenders use this argument to justify charging higher interest rates, which results in a higher profit margin. However, an October 2023 study by Veterans United Home Loans concludes that VA loans close within 40 to 50 days, which is typical for the mortgage industry.
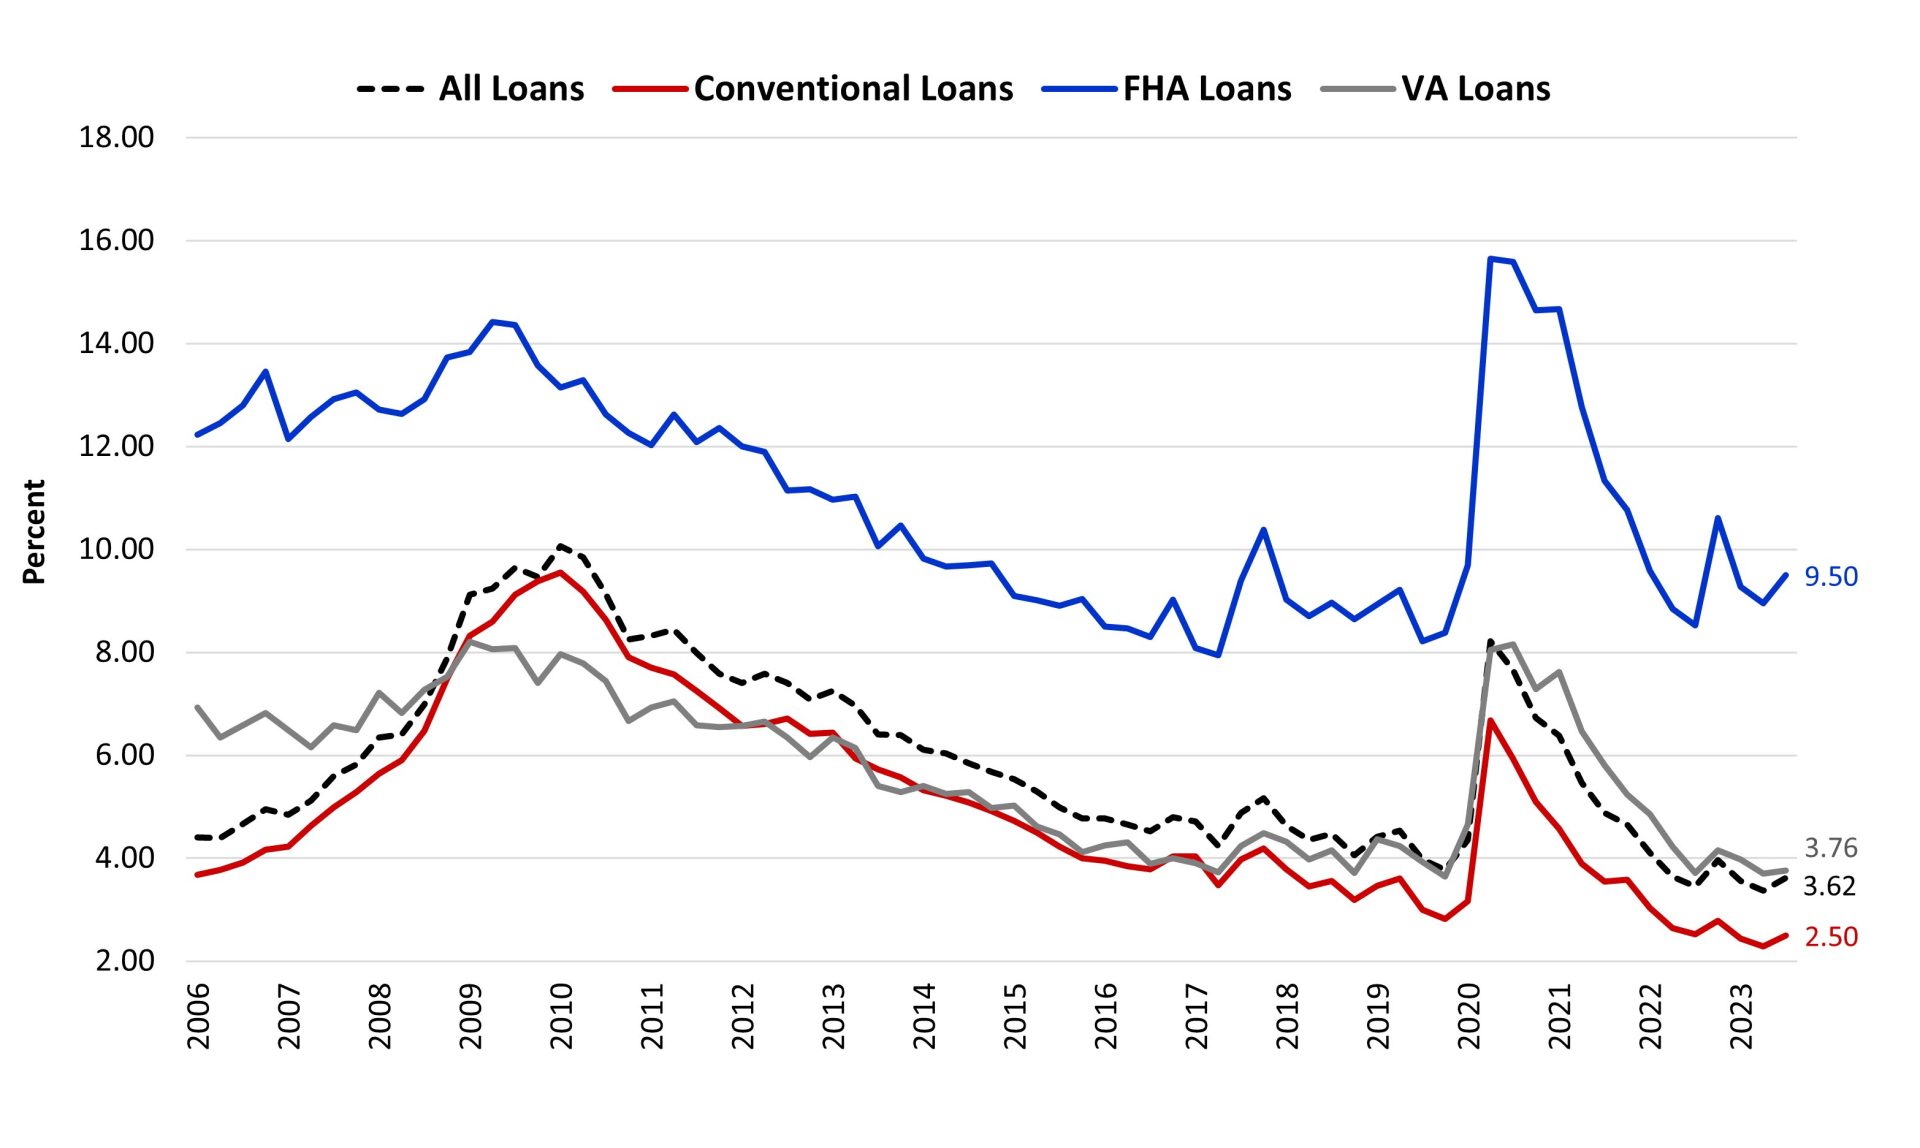
Lenders also try to justify higher mortgage rates by claiming that delinquency rates for VA borrowers are higher than those for conventional borrowers. However, data from the Mortgage Bankers Association provided in the chart below, shows that the long-run average of delinquency rates for VA loans is similar to that of conventional loans.
Year-Over-Year Delinquency Rates: VA vs Conventional Loans
For these alleged “inconveniences,” lenders charge more. This held true in 2023 as the rate range among top VA lenders increased by more than half a percentage point in 2022.
With total loan amounts in the billions of dollars among top lenders, and average loan amounts exceeding $300,000 for top 10 lenders, VA borrowers must ensure that they are not being taken advantage of. We have included the most recent 2023 U.S. Department of Veterans Affairs data in the following chart:
FY 2023 Total Lender Loan Volume
| Rank | Lender Name | Loans Guaranteed | Avg. Loan Amount | Total Loan Amount |
| 1 | VETERANS UNITED HOME LOANS | 58,253 | $302,992 | $17,650,217,781 |
| 2 | UNITED WHOLESALE MORTGAGE, LLC | 29,901 | $429,192 | $12,833,265,298 |
| 3 | ROCKET MORTGAGE, LLC | 22,553 | $334,263 | $7,538,636,306 |
| 4 | NAVY FEDERAL CREDIT UNION | 16,014 | $374,250 | $6,367,495,459 |
| 5 | DHI MORTGAGE COMPANY LTD | 10,718 | $361,478 | $3,874,323,751 |
| 6 | LOANDEPOT.COM, LLC | 9,087 | $381,908 | $3,470,395,949 |
| 7 | USAA FSB | 8,608 | $349,796 | $3,011,047,448 |
| 8 | FREEDOM MORTGAGE CORP | 8,191 | $341,641 | $2,798,382,891 |
| 9 | FAIRWAY INDEPENDENT MTG CORP | 8,037 | $392,603 | $3,155,350,207 |
| 10 | PENNYMAC LOAN SERVICES LLC | 7,382 | $359,778 | $2,655,882,147 |
2. VA Lenders can charge some of the highest origination fees in the industry
VA lenders are authorized by law to charge origination fees of up to 1% of the loan amount. Meanwhile, conventional loans typically range from between 0.5% to 1% of the loan amount, which are sometimes reduced in negotiations. Therefore, VA borrowers should make sure that they’re not being charged exorbitant fees. VA borrowers can also expect a “funding fee”, which in 2023 was a one-time charge that ranged up to 3.3 percent of the loan. This is in addition to the allowable itemized closing fees including those for the loan recording, credit report, title exam, title insurance, and prepaid/escrow items. In sum, VA borrowers are paying a lot upfront, and some of these fees are entirely in the control of lenders.
3. VA borrowers are frequent targets of loan “churning” schemes
The VA program cited multiple lenders in 2018 with predatory lending practices which involved charging premium rates and fees on mortgages and then targeting them with offers to refinance their mortgage multiple times in a year, often without any meaningful financial benefit. The scheme often made use of the cash-out refinance, which reduced the borrower’s equity in their home. Because the VA program allows borrowers to roll loan closing costs into the loan balance on refinances, these transactions would often increase the borrower’s overall loan balance, leaving them “upside down” on the mortgage, or owing more than what the home is worth.
Though various regulations were put in place to combat “churning” schemes, borrowers still need to be cautious. A 2021 report from an Orange County representative titled: “AWOL: How Watchdogs are Failing to Protect Servicemembers from Financial Scams'' notes that potentially harmful cash-out refinances increased by 50 percent between January 2020 and August 2021, indicating that these schemes can go hand-in-hand with market rate drops. It is something that VA borrowers should be mindful of if rates decrease in 2023.
VA loan data study, 2023
VA loan rate spread similar to 2022, but a higher rate range underscores the need to shop around
- The rate spread for VA loans originated by the top 20 VA lenders mostly held steady from -0.15% to -0.07%. Rate spread is the difference between the average rates offered to VA borrowers and the average rates offered to all borrowers, based on data known as the Average Prime Offer Rate. VA borrowers, on average, were offered lower rates compared to other borrowers.
- The rate range for VA loans originated by the top 20 VA lenders increased moderately from 0.50% to 1.18%. Rate range is the difference between the highest and lowest rates offered to borrowers with comparable scenarios, holding constant for credit score, loan amount, and other factors that affect rates.
HMDA data analysis, 2023
To validate these findings, we conducted an analysis of data made public by the Home Mortgage Disclosure Act (HMDA). HMDA is a federal act approved in 1975 that requires mortgage lenders to keep records of certain key pieces of information regarding their lending practices, which they must submit to regulatory authorities. It was implemented by the Federal Reserve through Regulation C. HMDA data can be analyzed from a variety of angles, including the interest rates charged by lenders.
Our study of HMDA data verifies that many mortgage lenders overcharge borrowers, especially US Veterans. This table shows that of the top 20 VA lenders in 2022, six had a rate spread that was above the Average Prime Offer Rate (APOR)
| Lender | Average Rate Spread | Amount Originated in 2022 |
| DHI Mortgage Company | -0.52 | $3,647,335,000 |
| United Shore Financial Services | -0.48 | $15,843,615,000 |
| Pennymac Loan Servicing | -0.46 | $5,320,565,000 |
| Navy Federal Credit Union | -0.45 | $8,926,200,000 |
| Lennar Mortgage | -0.39 | $1,692,780,000 |
| Rocket Mortgage | -0.27 | $12,128,175,000 |
| USAA Federal Savings Bank | -0.21 | $4,607,265,000 |
| Home Point Financial Corporation | -0.21 | $2,427,080,000 |
| Loandepot.com | -0.11 | $5,916,990,000 |
| Guaranteed Rate | -0.08 | $2,813,385,000 |
| CMG Mortgage Inc | -0.08 | $1,706,310,000 |
| The Federal Savings Bank | 0.04 | $2,116,055,000 |
| Movement Mortgage | 0.05 | $2,876,140,000 |
| Caliber Home Loans | 0.07 | $3,220,040,000 |
| Fairway Independent Mortgage | 0.12 | $4,093,660,000 |
| Guild Mortgage Company | 0.17 | $1,785,695,000 |
| Freedom Mortgage Corporation | 0.17 | $7,384,960,000 |
| Crosscountry Mortgage | 0.23 | $3,063,880,000 |
| Mortgage Research Center | 0.30 | $22,474,650,000 |
| New Day Financial | 0.66 | $2,922,695,000 |
***This list comprises the Top 20 VA lenders in 2022, by volume. It was created using objective, publicly available criteria and highlights the wide variability among financial outcomes across VA lenders. None of the top 20 VA lenders are members of Own Up’s lender marketplace.
****Average rate spread compares all VA loans originated by a lender in 2022 to the APOR at the time of origination. In the course of completing this study we also examined the Top 20 lenders’ rate spreads within a specific VA loan purpose (Purchase, Refinance & Cash-out Refinance) and we found similar variability within the specific categories.
VA loan data study, 2022
VA loan pricing metrics mostly consistent relative to 2021
- The rate spread for VA loans originated by the top 20 VA lenders mostly held steady from -0.21% to -0.15%. Rate spread is the difference between the average rates offered to VA borrowers and the average rates offered to all borrowers, based on data known as the Average Prime Offer Rate. VA borrowers, on average, were offered lower rates compared to other borrowers.
- The rate range for VA loans originated by the top 20 VA lenders held steady from 0.52% to 0.50%. Rate range is the difference between the highest and lowest rates offered to borrowers with comparable scenarios, holding constant for credit score, loan amount, and other factors that affect rates.
HMDA data analysis, 2022
To validate these findings, we conducted an analysis of data made public by the Home Mortgage Disclosure Act (HMDA). HMDA is a federal act approved in 1975 that requires mortgage lenders to keep records of certain key pieces of information regarding their lending practices, which they must submit to regulatory authorities. It was implemented by the Federal Reserve through Regulation C. HMDA data can be analyzed from a variety of angles, including the interest rates charged by lenders.
Our study of HMDA data verifies that many mortgage lenders overcharge borrowers, especially US Veterans. This table shows that of the top 20 VA lenders in 2021, six had a rate spread that was above the Average Prime Offer Rate (APOR)
| Lender | Average Rate Spread | Amount Originated in 2021 |
| PennyMac Servicing | -0.39 | $17,514,705,000 |
| Home Point Financial | -0.36 | $7,247,505,000 |
| Freedom Mortgage | -0.36 | $43,105,215,000 |
| United Shore Financial Services | -0.34 | $15,085,660,000 |
| Navy Federal Credit Union | -0.33 | $12,749,420,000 |
| Lakeview Loan Servicing | -0.31 | $7,039,960,000 |
| Quicken Loans | -0.28 | $29,725,070,000 |
| Caliber Home Loans | -0.26 | $10,591,870,000 |
| Loan Depot | -0.25 | $12,099,190,000 |
| Wells Fargo | -0.23 | $3,804,750,000 |
| The Federal Savings Bank | -0.17 | $4,290,660,000 |
| DHI Mortgage | -0.12 | $2,913,815,000 |
| HomeBridge Financial | -0.03 | $2,435,940,000 |
| Guild Mortgage | -0.02 | $3,674,795,000 |
| Nationstar Mortgage | 0.02 | $4,485,460,000 |
| Mortgage Research Center | 0.04 | $29,702,320,000 |
| USAA Federal Savings Bank | 0.05 | $7,812,730,000 |
| Movement Mortgage | 0.06 | $3,811,740,000 |
| New Day Financial | 0.08 | $5,782,700,000 |
| Fairway Independent | 0.11 | $5,556,295,000 |
***This list comprises the Top 20 VA lenders in 2021, by volume. It was created using objective, publicly available criteria and highlights the wide variability among financial outcomes across VA lenders. None of the top 20 VA lenders are members of Own Up’s lender marketplace.
****Average rate spread compares all VA loans originated by a lender in 2021 to the APOR at the time of origination. In the course of completing this study we also examined the Top 20 lenders’ rate spreads within a specific VA loan purpose (Purchase, Refinance & Cash-out Refinance) and we found similar variability within the specific categories.
VA loan data study, 2021
VA loan pricing improves for borrowers across two key metrics
- The rate spread for VA loans originated by the top 20 VA lenders improved from 0.04% to -0.21%. Rate spread is the difference between the average rates offered to VA borrowers and the average rates offered to all borrowers, based on data known as the Average Prime Offer Rate. Last year, VA borrowers, on average, were offered slightly higher rates than other borrowers, whereas this year they were offered lower rates compared to other borrowers.
- The rate range for VA loans originated by the top 20 VA lenders tightened from 1.25% to 0.52%. Rate range is the difference between the highest and lowest rates offered to borrowers with comparable scenarios, holding constant for credit score, loan amount, and other factors that affect rates.
A small number with a massive financial impact for borrowers
While 0.52% represents a significant reduction in the rate range among the top 20 VA lenders, that reduction brings that range in line with the broader market – a disparity in rates that represents a major financial gamble for borrowers who don’t effectively shop. A half percentage point over 30 years equates to roughly 10% of the purchase price of the home in extra interest payments. With so much at stake, VA borrowers, and all borrowers, should effectively comparison shop to gather up-to-date, customized pricing data and optimize their transaction.
Compare mortgage offers and save money. Get Started.
Opaque market factors leave borrowers in the dark
Our updated analysis also shows that while some lenders improved in tightening their range of rates offered to similar VA borrowers, others saw a widening of that range. Lakeview Loan Servicing, for example, moved from 11th place to 3rd place. Navy Federal Credit Union, however, moved from 1st place to 13th place this past year.
So what’s the reason for the shift? It’s hard to pinpoint, but the answer is a combination of factors that borrowers, let alone mortgage industry insiders, don’t have complete visibility into.
Some factors that influencer lender pricing are lender profitability targets, market conditions, and shifting industry wide standards that dictate pricing. Borrowers have little or no insight into both industry wide and lender specific forces that influence the rates they are offered.
Lenders make more money when borrowers close loans with higher interest rates and pay more in fees. Because of the opaque nature of mortgage pricing, and the barriers to effective comparison shopping, lenders have the ability to overcharge borrowers without them even knowing it.
HMDA data analysis, 2021
To validate these findings, we conducted an analysis of data made public by the Home Mortgage Disclosure Act (HMDA). HMDA is a federal act approved in 1975 that requires mortgage lenders to keep records of certain key pieces of information regarding their lending practices, which they must submit to regulatory authorities. It was implemented by the Federal Reserve through Regulation C. HMDA data can be analyzed from a variety of angles, including the interest rates charged by lenders.
Our study of HMDA data verifies that many mortgage lenders overcharge borrowers, especially US Veterans. This table shows that of the top 20 VA lenders in 2020, two had a rate spread that was above the Average Prime Offer Rate (APOR)
| Lender | Average Rate Spread | Amount Originated in 2020 |
| United Shore Financial Services | -0.43 | $20,373,755,000 |
| Home Point Financial | -0.33 | $4,896,225,000 |
| Lakeview Loan Servicing | -0.33 | $9,061,745,000 |
| Loan Depot | -0.33 | $11,284,815,000 |
| PennyMac Servicing | -0.32 | $12,093,580,000 |
| DHI Mortgage | -0.31 | $2,674,945,000 |
| Freedom Mortgage | -0.31 | $56,103,400,000 |
| The Federal Savings Bank | -0.3 | $6,571,645,000 |
| Wells Fargo | -0.26 | $4,447,150,000 |
| Quicken Loans | -0.26 | $31,420,295,000 |
| Caliber Home Loans | -0.26 | $9,708,420,000 |
| HomeBridge Financial | -0.18 | $3,244,450,000 |
| Navy Federal Credit Union | -0.18 | $9,649,870,000 |
| Nationstar Mortgage | -0.13 | $7,695,180,000 |
| New Day Financial | -0.13 | $5,436,835,000 |
| Guild Mortgage | -0.1 | $3,977,065,000 |
| Movement Mortgage | -0.05 | $3,800,595,000 |
| Mortgage Research Center | -0.05 | $25,174,850,000 |
| Fairway Independent | 0.05 | $5,860,725,000 |
| USAA Federal Savings Bank | 0.09 | $11,028,135,000 |
***This list comprises the Top 20 VA lenders in 2020, by volume. It was created using objective, publicly available criteria and highlights the wide variability among financial outcomes across VA lenders. None of the top 20 VA lenders are members of Own Up’s lender marketplace.
****Average rate spread compares all VA loans originated by a lender in 2020 to the APOR at the time of origination. In the course of completing this study we also examined the Top 20 lenders’ rate spreads within a specific VA loan purpose (Purchase, Refinance & Cash-out Refinance) and we found similar variability within the specific categories.
VA loan data study, 2020
One group of borrowers that is negatively impacted by the nefarious behavior of certain mortgage lenders are US Veterans, who account for more than 20% of homebuyers according to the National Association of Realtors (NAR).
HMDA data analysis, 2020
To validate these findings, we conducted an analysis of data made public by the Home Mortgage Disclosure Act (HMDA). HMDA is a federal act approved in 1975 that requires mortgage lenders to keep records of certain key pieces of information regarding their lending practices, which they must submit to regulatory authorities. It was implemented by the Federal Reserve through Regulation C. HMDA data can be analyzed from a variety of angles, including the interest rates charged by lenders.
Our study of HMDA data verifies that many mortgage lenders overcharge borrowers, especially US Veterans. This table shows that of the top 20 VA lenders in 2019, ten had a rate spread that was above the Average Prime Offer Rate (APOR)
| Lender | Average Rate Spread | Amount Originated in 2019 |
| Navy Federal Credit Union | -0.359 | 10,525,605,000 |
| United Shore Financial Services | -0.230 | 11,488,655,000 |
| Home Point Financial | -0.143 | 2,698,160,000 |
| PennyMac Servicing | -0.136 | 5,407,320,000 |
| Wells Fargo | -0.071 | 2,703,585,000 |
| DHI Mortgage | -0.064 | 1,938,275,000 |
| Caliber Home Loans | -0.056 | 6,806,660,000 |
| Loan Depot | -0.051 | 6,143,360,000 |
| HomeBridge Financial | -0.028 | 3,572,140,000 |
| USAA Federal Savings Bank | -0.002 | 12,256,935,000 |
| Lakeview Loan Servicing | 0.003 | 1,878,080,000 |
| Quicken Loans | 0.026 | 15,544,215,000 |
| Freedom Mortgage | 0.035 | 11,631,245,000 |
| Mortgage Research Center | 0.147 | 15,970,615,000 |
| Movement Mortgage | 0.160 | 2,472,950,000 |
| Guild Mortgage | 0.168 | 2,691,385,000 |
| The Federal Savings Bank | 0.169 | 3,358,600,000 |
| Nationstar Mortgage | 0.179 | 4,736,015,000 |
| Fairway Independent | 0.237 | 4,403,520,000 |
| New Day Financial | 0.889 | 2,418,320,000 |
***This list comprises the Top 20 VA lenders in 2019, by volume. It was created using objective, publicly available criteria and highlights the wide variability among financial outcomes across VA lenders. None of the top 20 VA lenders are members of Own Up’s lender network.
****Average rate spread compares all VA loans originated by a lender in 2019 to the APOR at the time of origination. In the course of completing this study we also examined the Top 20 lenders’ rate spreads within a specific VA loan purpose (Purchase, Refinance & Cash-out Refinance) and we found similar variability within the specific categories.
The bottom line
- Lowest spread = -0.359
- Average spread = 0.04%
- Highest spread = 0.889%
- Highest - Lowest = 1.25%
Based on these calculations if a borrower were to secure a loan with a lender with the lowest Annual Percentage Rate (APR) to APOR spread, which was Navy Federal Credit Union, instead of the lender with the highest APR to APOR spread, which was New Day Financial, they would secure an APR that is 1.25% better. This table shows the impact to the borrower:
| Balance of Mortgage | $301,044 |
| Rate of Best Mortgage of Top 20 | 2.50% |
| Rate of Worst Mortgage of Top 20 | 3.75% |
| Term in Years | 30 |
| Total Payments of Best Mortgage | $428,213 |
| Total Payments of Worst Mortgage | $501,901 |
| Cost Difference | $73,688 |
We conducted the same analysis to the VA loans originated by lenders in the Own Up Lender marketplace. The average rate spread between APR and APOR was -0.542%, which is 0.183% better than the VA lender with the lowest interest rates in the top 20 lenders in 2019.
Because we require our lender partners to stay below set pricing standards as a condition of being in our marketplace, we're able to ensure that our customers, including those seeking VA loans, secure fair interest rates.
What’s apparent from our study is that all borrowers are not treated equally. But more disturbingly, our veterans and those actively serving in the military, citizens who should be revered for their service to our country, are being taken advantage of by certain lenders. It is our hope that this study causes lenders to evaluate their pricing policies, especially on VA loans, as it appears disingenuous to celebrate our veterans while simultaneously overcharging them. Moreover, our hope with this study is to educate consumers on the importance of shopping among multiple mortgage lenders before selecting one. Data from HMDA shows unequivocally that interest rates and closing costs can vary widely among lenders, so it's imperative that you find a lender that offers fair terms.
Methodology
The purpose of the study was to examine potential differences in financial outcomes that occurred among borrowers of VA loans in 2019.
Data for this study was taken from publicly available sources, including the Home Mortgage Disclosure Act Platform (HMDA), Ellie Mae’s Insight Reports, and the Department of Veterans Affairs. The primary source for this data was HMDA, which was used to compare the rate spread between the Annualized Percentage Rates (APR) on loans made by the Top 20 VA lenders in 2019, and the Average Prime Offer Rate (APOR), an index which is published weekly. This rate spread is generated by subtracting the APOR (index) from the APR (lender reported) for loans made in the same time period by a given lender.
A sample rate spread calculation can be conducted by entering the amortization type (fixed vs. variable), the date a loan was originated, the APR on the loan being compared, and the term of the loan. The calculated rate spread allows us to assess whether an originated loan is priced better or worse than the APOR. However, just looking at absolute rate spreads is insufficient. Effective analysis must account for the rate spreads across lenders within the same loan type (VA loans in the case of our study) to assess competitiveness. Lenders with relatively low or negative rate spreads represent better terms to borrowers, while positive, high rate spreads represent worse terms.